
This is Part 1 of a series on getting your EBITDA out of QuickBooks — from a number you calculate by hand to a live dashboard you can pull any time.
- What EBITDA is and how to get it from QuickBooks — you’re here.
- Connecting and testing the QuickBooks API
- Building your own EBITDA dashboard
- Sharing your dashboard with your team
You’re sitting in a peer group, a mastermind, or a session with your business coach, and the question lands: “So, what’s your EBITDA?”
You run QuickBooks Online. Everything’s in there. So you nod, make a note to pull it up later, and figure it’s a quick report. Then you go looking — and there’s no EBITDA report. No EBITDA button. No calculator. QuickBooks will hand you a Profit and Loss statement all day long, but the one number your peer group actually asked for isn’t anywhere in the menu.
This trips up a lot of owners, because EBITDA feels like it should be standard. It is standard — it’s just not something QuickBooks calculates for you. Let’s fix that.
First, what is EBITDA?
EBITDA stands for Earnings Before Interest, Taxes, Depreciation, and Amortization. Say it slowly and it explains itself: it’s your earnings before four specific things are subtracted.
- Interest — what you pay to borrow money. Tied to how you financed the business, not how well it operates.
- Taxes — income taxes, which depend on your entity type and tax situation, not your operations.
- Depreciation — the bookkeeping write-down of physical assets (equipment, vehicles) over time. A non-cash expense.
- Amortization — the same idea for intangible assets, like a purchased customer list or software. Also non-cash.
The point of stripping those four out is to get at a clean measure of how much cash the core business actually generates from operations, before financing choices, tax circumstances, and bookkeeping write-downs muddy the picture. Two businesses can have wildly different debt and tax situations but very similar EBITDA — which is exactly why investors, lenders, buyers, and peer groups lean on it. It lets you compare businesses apples-to-apples, and it’s the number most often used as the basis for what a business is worth (a multiple of EBITDA). That’s why it comes up in coaching and peer groups constantly. It’s the scoreboard.
Why QuickBooks won’t just hand it to you
QuickBooks knows every number EBITDA is built from — it just never adds them up that way. Its job is to produce standard financial statements, and EBITDA isn’t one of them; it’s a derived figure that different people calculate slightly differently (more on that when we get to Adjusted EBITDA). So QuickBooks gives you the raw material — the Profit and Loss — and leaves the assembly to you. The good news: the assembly is simple once you know where to look.
Step 1: Pull your Profit and Loss from QuickBooks
In QuickBooks Online, go to Reports, then open Profit and Loss (it’s usually pinned at the top under “Favorites” or “Business overview”).
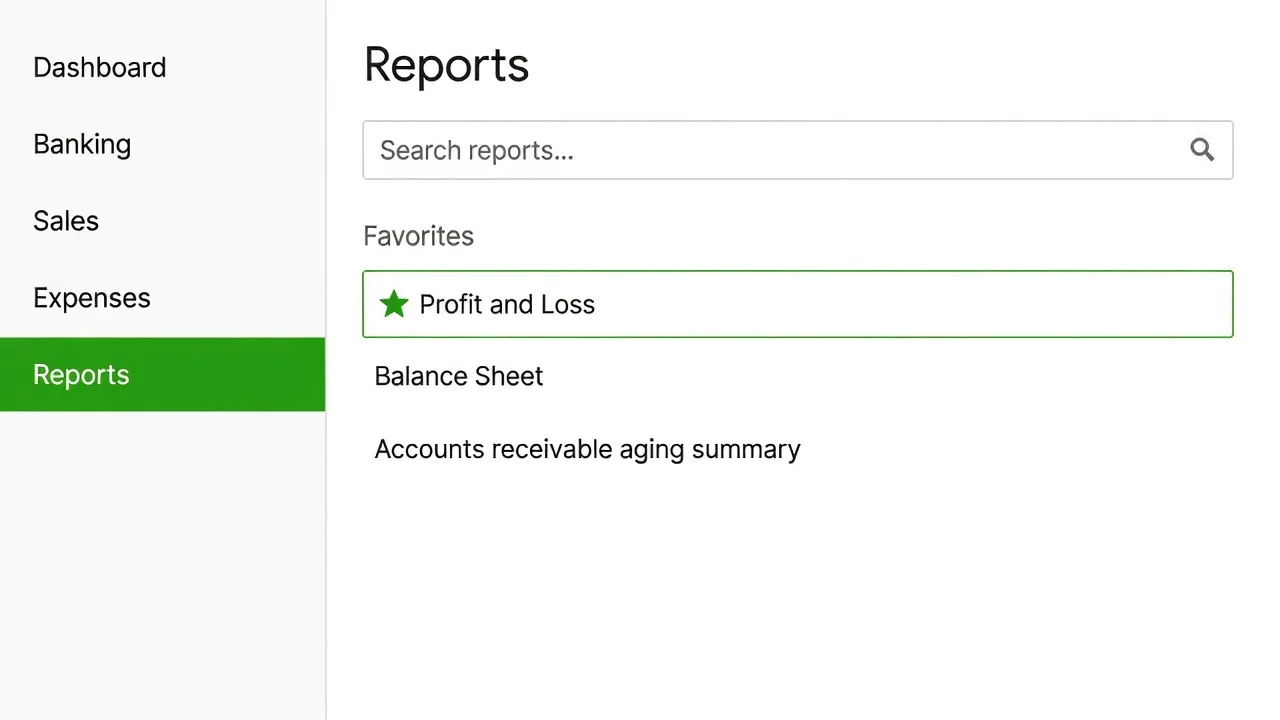
Set the date range you’ve been asked about — last quarter, last fiscal year, or “year to date” — and click Run report. The figure at the very bottom, Net Income, is your starting point. Everything else is an adjustment to it.
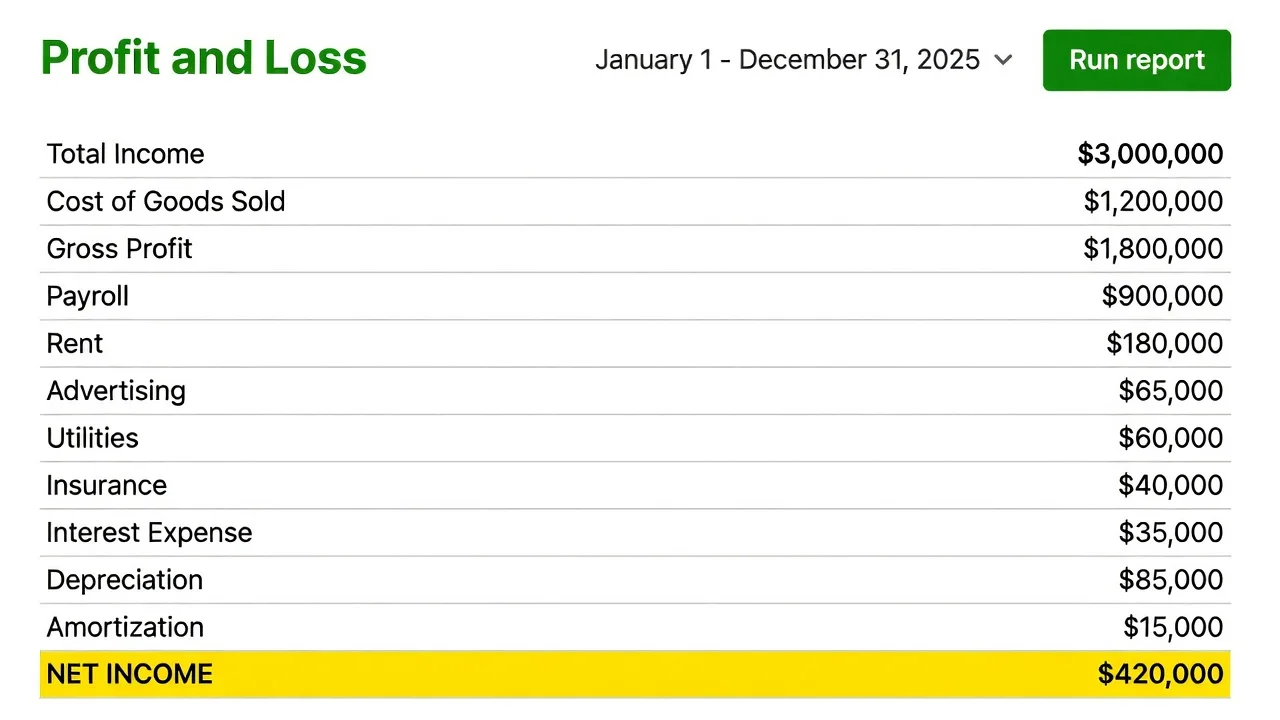
Step 2: Find the four add-backs on the report
Now scan the same report for the four lines you need to add back to Net Income. They live in the expense and “other expense” sections, and they aren’t always neatly grouped together:
- Interest Expense — often near the bottom, under Other Expenses.
- Income Taxes — only if your entity books them. Many S-corps, LLCs, and sole proprietors don’t show federal income tax on the company P&L, so this is frequently $0. (Don’t add back payroll or sales taxes — only income taxes belong here.)
- Depreciation — its own expense line.
- Amortization — its own expense line, if you have intangible assets.
Heads up on depreciation and amortization: these are the ones most likely to bite you. Lots of businesses only post them at year-end, via a journal entry from a separate fixed-asset schedule your accountant keeps. If you’re pulling a mid-year number and the depreciation line looks suspiciously small or empty, that’s why — ask your accountant for the current figures.
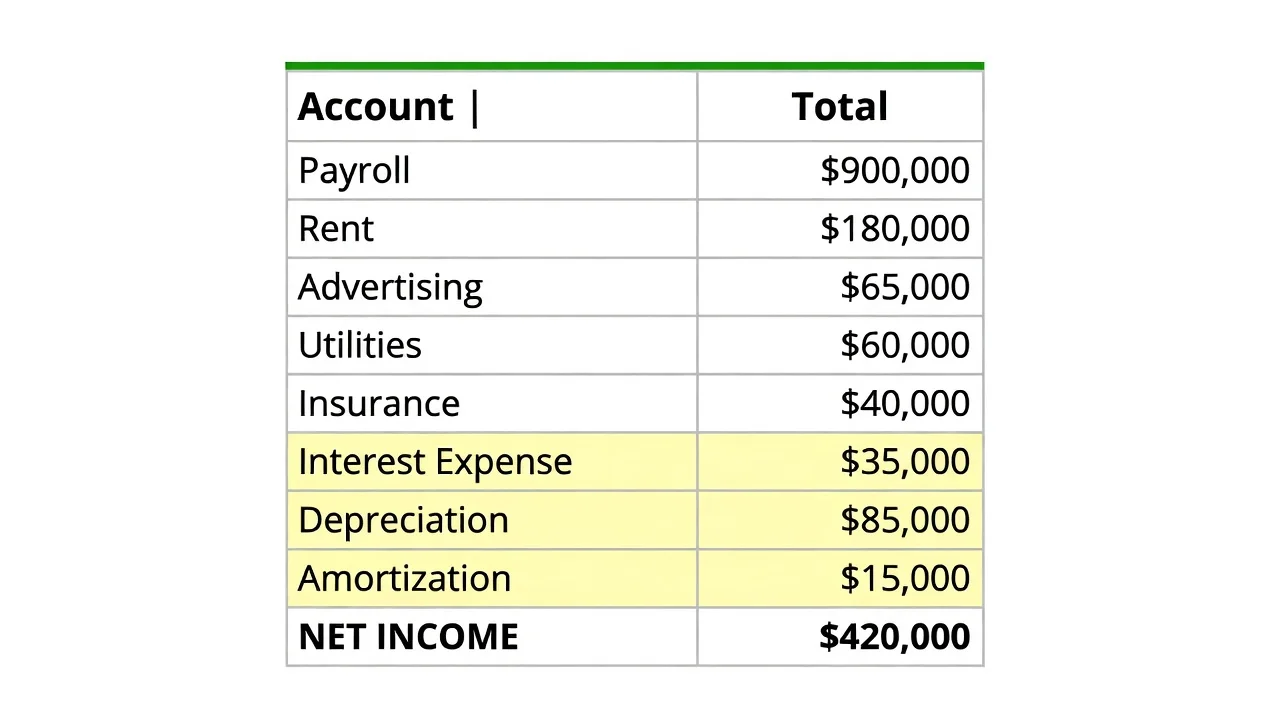
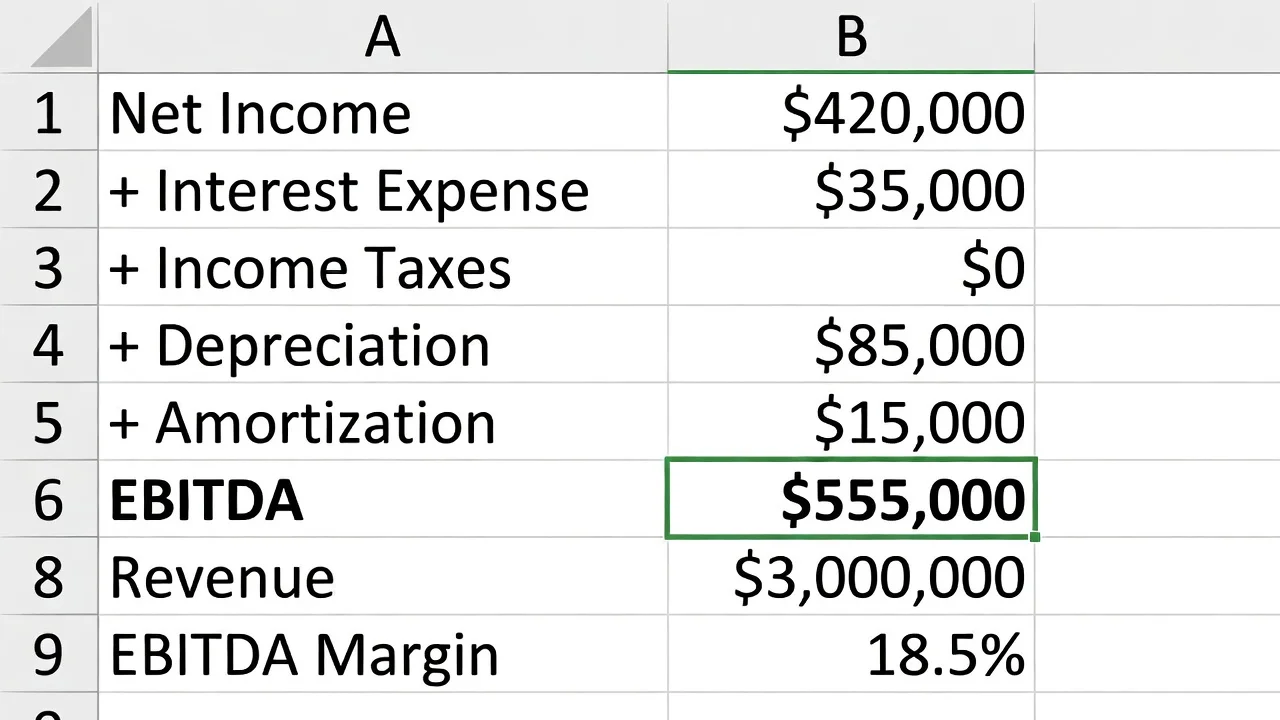
Step 3: Do the math
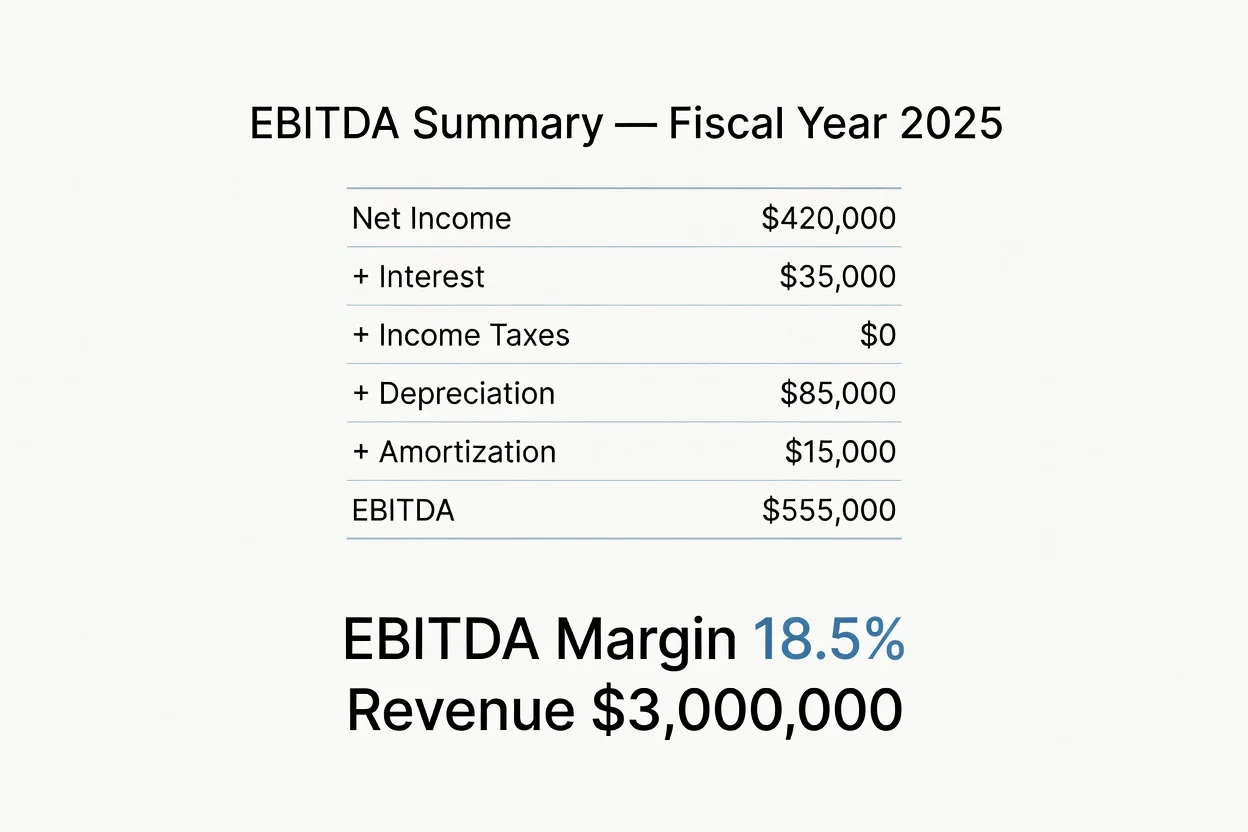
EBITDA is just addition once you have the five numbers. Here’s a typical small business example:
| Line | Where it comes from | Amount |
|---|---|---|
| Net Income | Bottom of the P&L | $420,000 |
| + Interest Expense | Other Expenses | $35,000 |
| + Income Taxes | Income tax line (often $0 for pass-throughs) | $0 |
| + Depreciation | Expense line | $85,000 |
| + Amortization | Expense line | $15,000 |
| = EBITDA | $555,000 |
If you want your EBITDA margin, divide EBITDA by total revenue. On $3,000,000 of revenue, $555,000 of EBITDA is an 18.5% margin — and the margin is often what your peer group really wants to compare, because it’s size-independent.
Adjusted EBITDA: the number your peer group probably means
There’s a wrinkle worth knowing. When a buyer, a lender, or a sharp peer group asks about your earnings, they often want Adjusted EBITDA — EBITDA with a few more add-backs that are specific to you as the owner:
- An owner salary that’s above (or below) what you’d pay a hired manager to do your job.
- Personal expenses run through the business — the vehicle, the travel, the phone.
- One-time costs that won’t recur — a lawsuit, a big repair, a system you bought once.
Adjusting for those shows what the business would earn in someone else’s hands, which is the whole question behind a valuation. (For smaller owner-operated businesses, a close cousin called Seller’s Discretionary Earnings does the same job.) It’s also why EBITDA is central to getting a business sale-ready. The catch: every one of those add-backs is another line to track down — which is exactly where a little AI help starts to pay off.
Let AI make it look good
You’ve got the numbers. Now make them presentable — and let AI do the arithmetic and the layout so you don’t fumble it in a spreadsheet. Export your Profit and Loss from QuickBooks (the Export button at the top of the report gives you a PDF or Excel file), then hand it to Claude:
“Attached is my Profit and Loss from QuickBooks for [date range]. Calculate my EBITDA by starting from Net Income and adding back interest expense, income taxes, depreciation, and amortization. Show the build-up line by line, calculate my EBITDA margin against total revenue, and lay it out as a clean one-page summary I could show my peer group.”
Claude reads the report, finds the right lines, does the math, and formats it into something you’d actually be comfortable putting on screen.
Want the adjusted version too? Just ask in a follow-up:
“Now add an Adjusted EBITDA column that also adds back $60,000 of owner salary above market, $9,000 of personal vehicle expense, and a one-time $12,000 legal bill. Show EBITDA and Adjusted EBITDA side by side.”
A word on safety: your P&L is sensitive. Use a paid, business-grade AI plan where your data isn’t used for training — not a free consumer chatbot — and redact anything the tool doesn’t need to see. We cover the difference in AI assistants compared, and if you’re new to working with Claude on spreadsheets, the Claude AI cheat sheet and Claude in Excel are good next reads.
The catch: you’ll do this again next quarter
Here’s the honest part. What you just did works, but look at everything it took: a report pull, a hunt for four line items, a call to your accountant for the depreciation that wasn’t posted yet, an export, and an AI prompt. Do it once and it’s fine. Do it every quarter — or every time someone asks — and it gets old fast. And the moment you want a different date range, you start over.
That’s the itch the rest of this series scratches. Instead of pulling and prompting by hand each time, you can connect QuickBooks directly to a tool that calculates EBITDA on demand — pick a date range, get the number, see the trend. It starts with QuickBooks’ API, the secure doorway that lets software read your accounting data for you. (If “API” is a new word, our What Is an API? explainer is the two-minute version.)
Next in this series
Part 2: Connecting and testing the QuickBooks API — creating an Intuit developer account, getting your API keys (and keeping them private), and proving you can pull your P&L automatically.
If you’d rather not wait, or you’d like this set up for you from the start, that’s squarely what we do — see our IT consulting in Houston or book a discovery call and tell us which numbers you wish lived on one screen.