

This is Part 3 of a series on getting your EBITDA out of QuickBooks, from a number you calculate by hand to a live dashboard you can pull any time.
- What EBITDA is and how to get it from QuickBooks
- Connecting and testing the QuickBooks API
- Building your own EBITDA dashboard, you’re here.
- Sharing your dashboard with your team
Here’s where the series has landed so far. Part 1: you can calculate EBITDA by hand from a P&L export. Part 2: you have real API credentials, and you’ve proven, with a 200 OK in Postman, that software can pull that same P&L on demand. What’s missing is the part you’d actually use, a screen. Something you open in a browser, pick “last quarter,” and read the number.
That’s today’s build. And the twist that makes it doable in an afternoon instead of a month: you’re not going to write the code. Claude Code, Anthropic’s AI coding tool that works on your own computer, writes it. Your job is to describe the dashboard clearly, hand over the credentials safely, and check its work, which, conveniently, is exactly the skill you built in Parts 1 and 2.
What we’re building
One small web application that runs on your own machine and does four things:
- A Connect to QuickBooks button that runs the same OAuth flow you did in Postman, except now the app handles it, and remembers the connection.
- A date-range picker, this month, last quarter, year to date, or any custom range.
- The EBITDA build-up, calculated automatically: Net Income pulled from the P&L, the four add-backs found and added, margin computed against revenue, the same math from Part 1, done by software in under a second.
- A trend line, EBITDA by month, so you see direction and not just a snapshot.
Everything runs locally and talks to the sandbox company from Part 2, fake data, zero risk. Pointing it at your real books and sharing it with your team is Part 4’s job.
Step 1: Install the Claude desktop app
You don’t need a terminal for this. Claude Code, Anthropic’s AI coding tool, now lives inside the regular Claude desktop app, chat, Cowork, and Code, all in one place. Download it for Windows or Mac at claude.com/download and sign in.
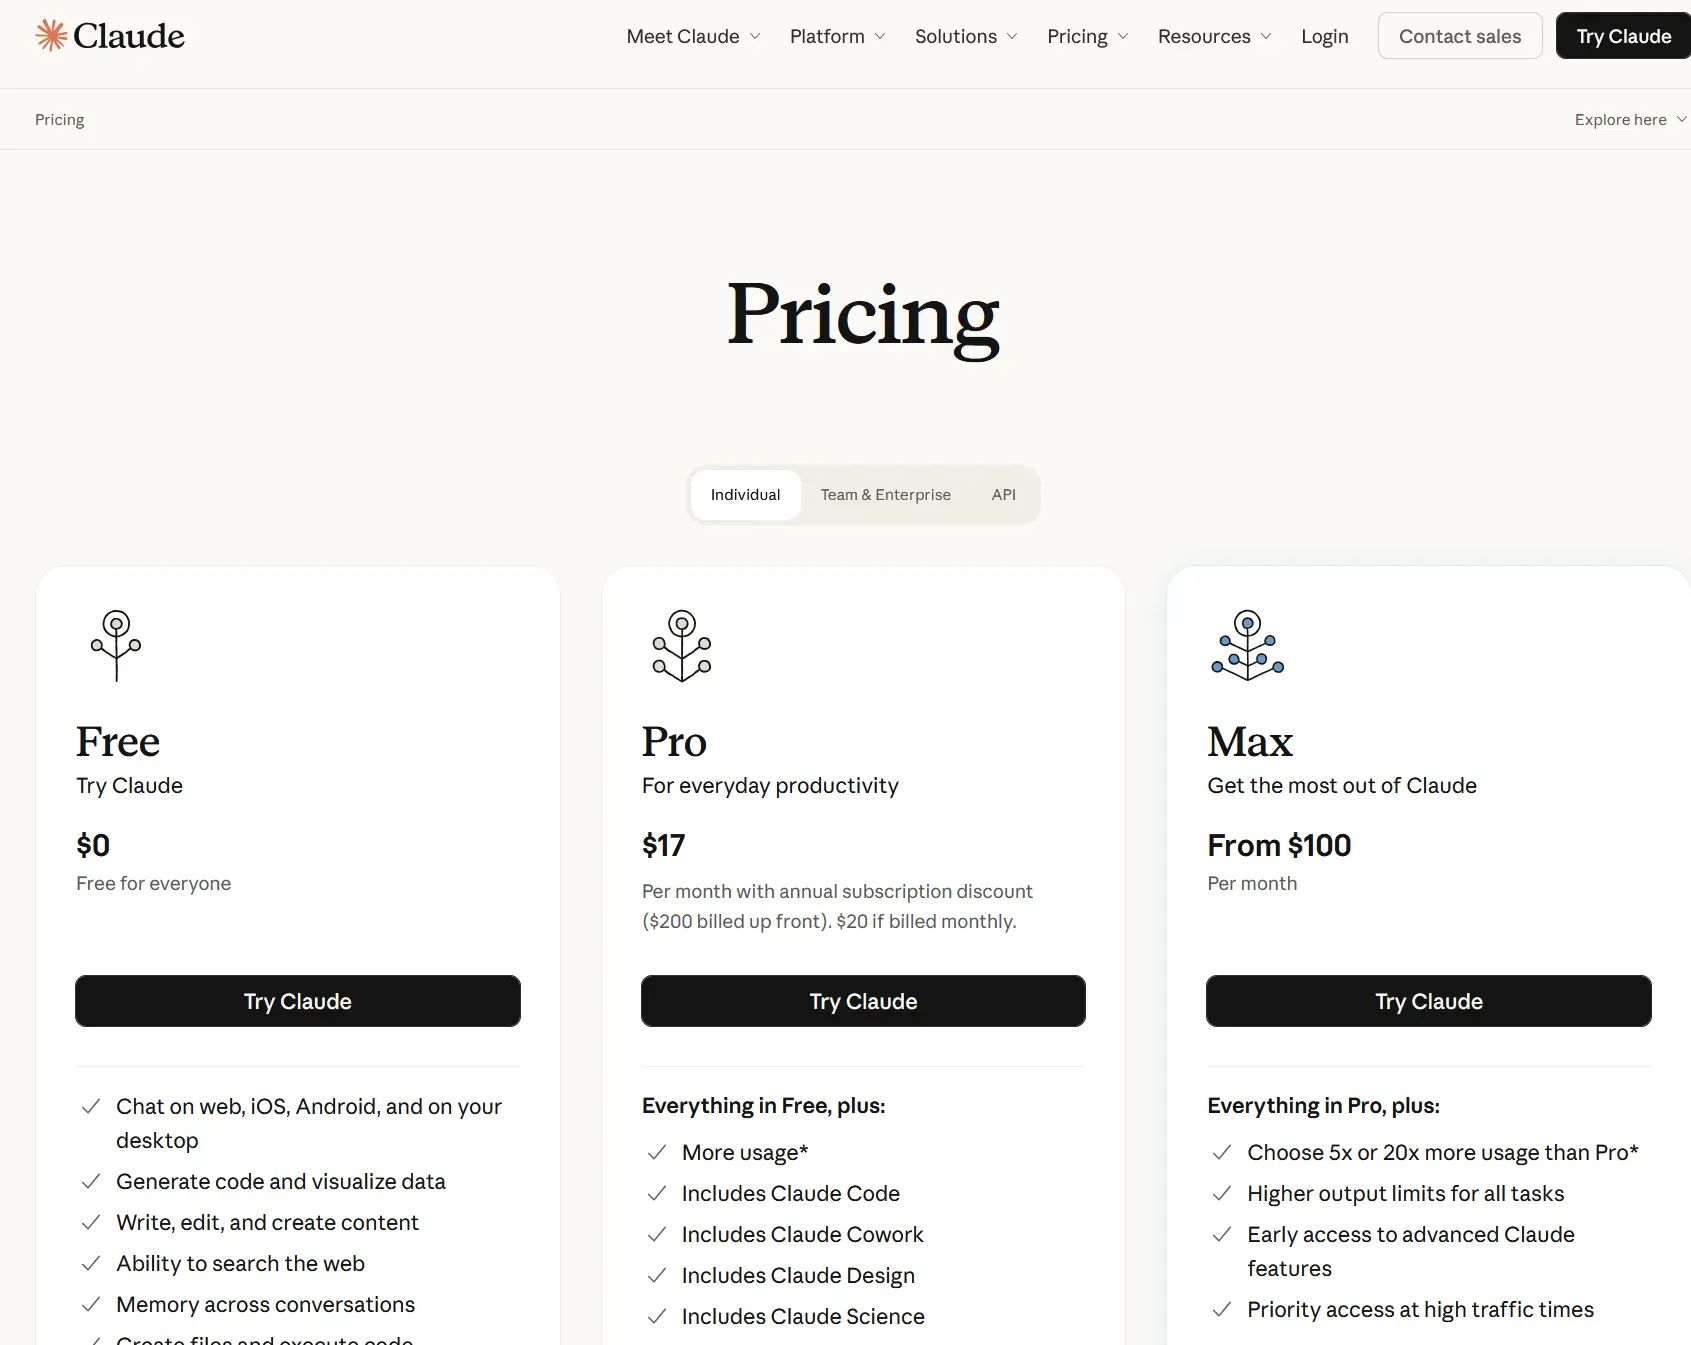
One plan note: Claude Code isn’t on the free tier. The Pro plan ($20/month, or $17 with annual billing) includes it, and that’s plenty for this build. Max exists for heavy daily use, you don’t need it for a dashboard.
Step 2: Put your credentials somewhere the code can’t leak them
Before any code gets written, decide where the secrets live, because the worst place for them is inside the code. The rule is simple: credentials go in an environment file, code reads them from there, and that file never leaves your machine.
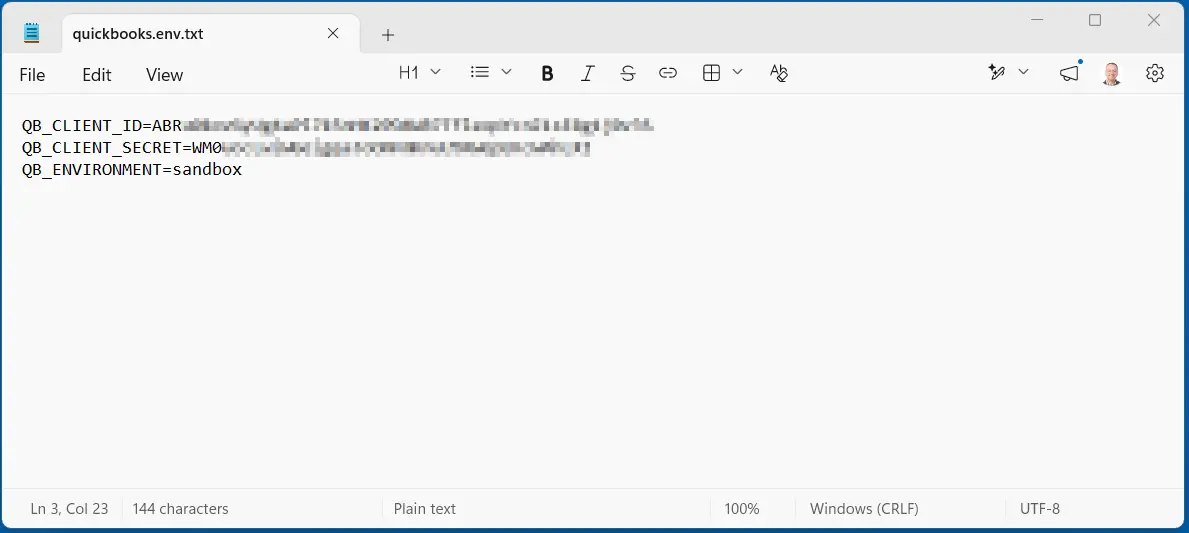
Open Notepad (or any plain text editor) and create a small file with the values from Part 2, we named ours quickbooks.env.txt:
QB_CLIENT_ID=your-client-id-here
QB_CLIENT_SECRET=your-client-secret-here
QB_ENVIRONMENT=sandbox
Two notes on this:
- These are the same Development keys from Part 2’s “Keys and credentials” page. Still sandbox, still no real data in play.
- In a moment you’ll hand this file to Claude Code and have it become the project’s
.envfile, listed in.gitignore, the list of files that get left behind if the code is ever copied or shared. That one line is the difference between “my keys stayed home” and “my keys are in a backup somewhere I forgot about.”
Step 3: Register a redirect URI for your app
One piece of Intuit-side setup before the build. In Part 2, Postman handled the OAuth callback with its own hosted address. Your app is going to handle that callback itself now, at an address on your own machine, so Intuit needs to know that address is legitimate.
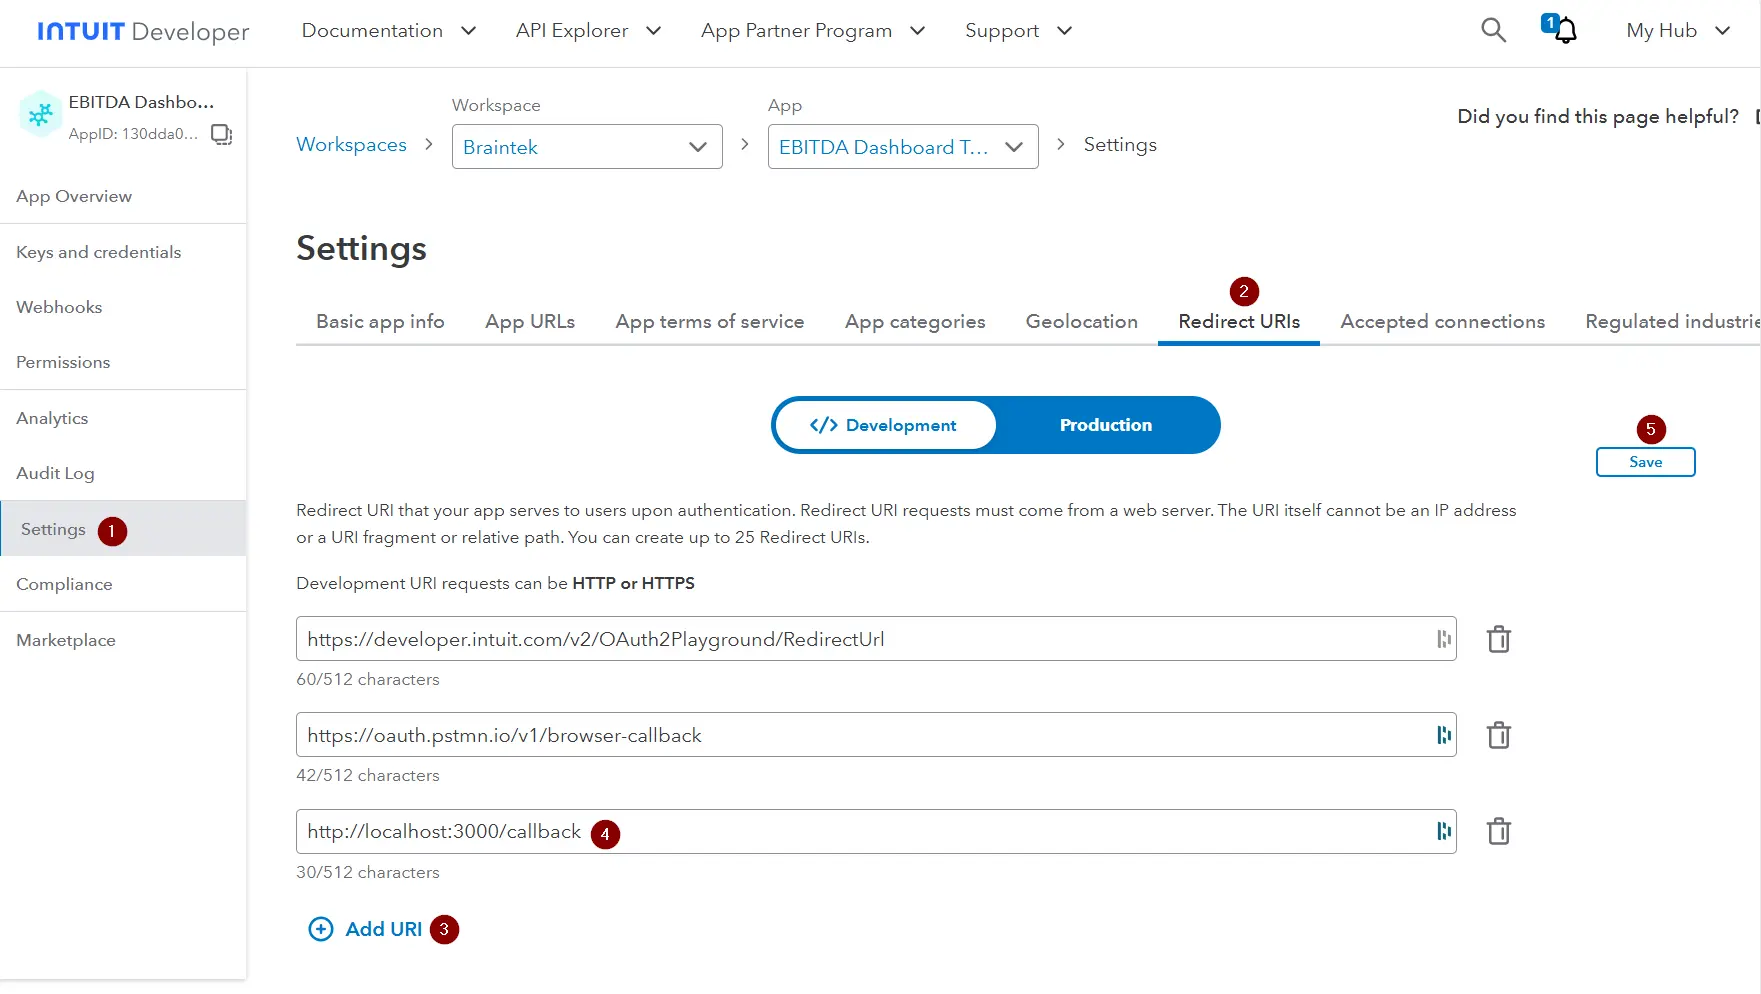
In your Intuit developer app, go to Settings → Redirect URIs, make sure the Development toggle is selected, click Add URI, and add:
http://localhost:3000/callback
Leave the existing entries (the Intuit default and your Postman one) alone, just add this as a third row and click Save. If Claude Code ends up running the app on a different port, you’ll add that instead, the address here has to match what the app actually uses, exactly, or Intuit will refuse the redirect. This is the single most common thing to get wrong in this whole article, so when the connection fails later, check here first.
Step 4: Open Claude Code and give it a home
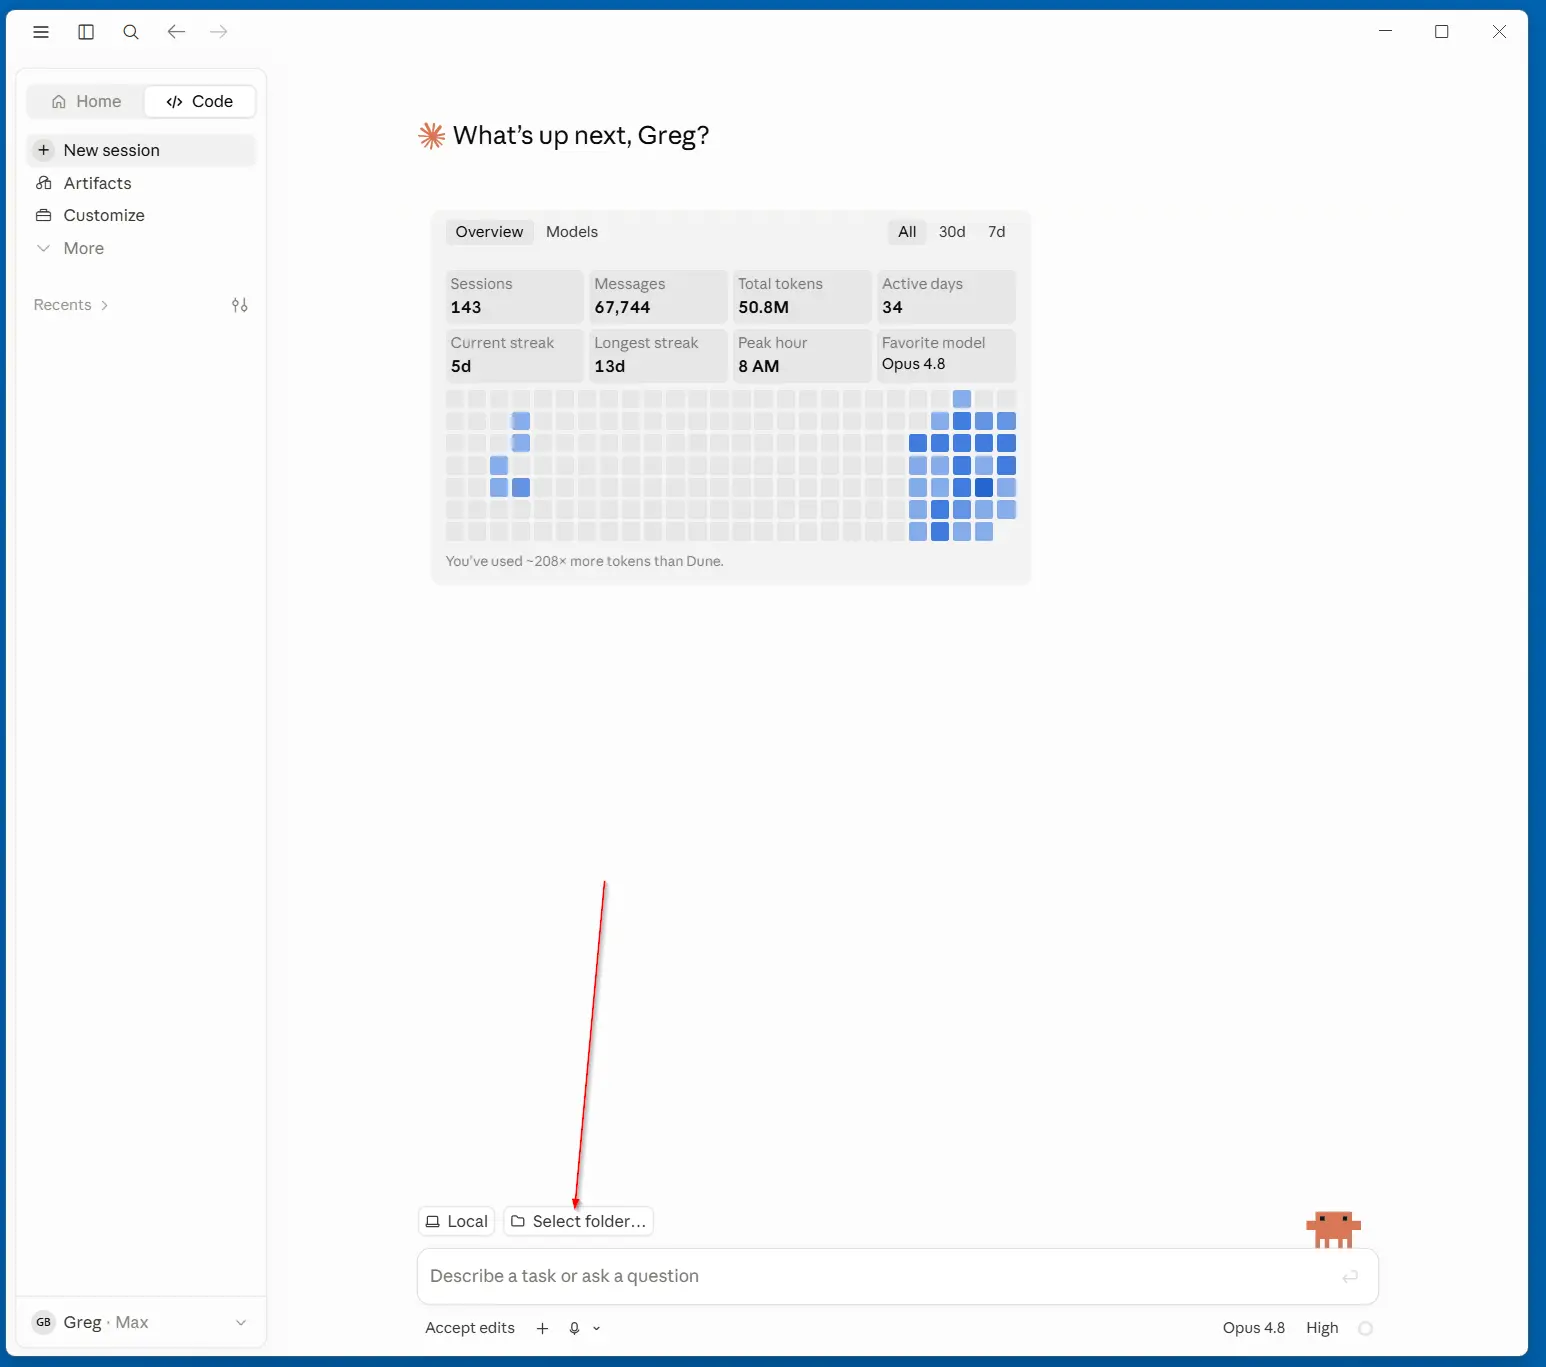
In the Claude desktop app, switch to the Code tab at the top left. Before you type anything, point it at a folder, that’s where the project’s files will live. Click Select folder just above the prompt box.
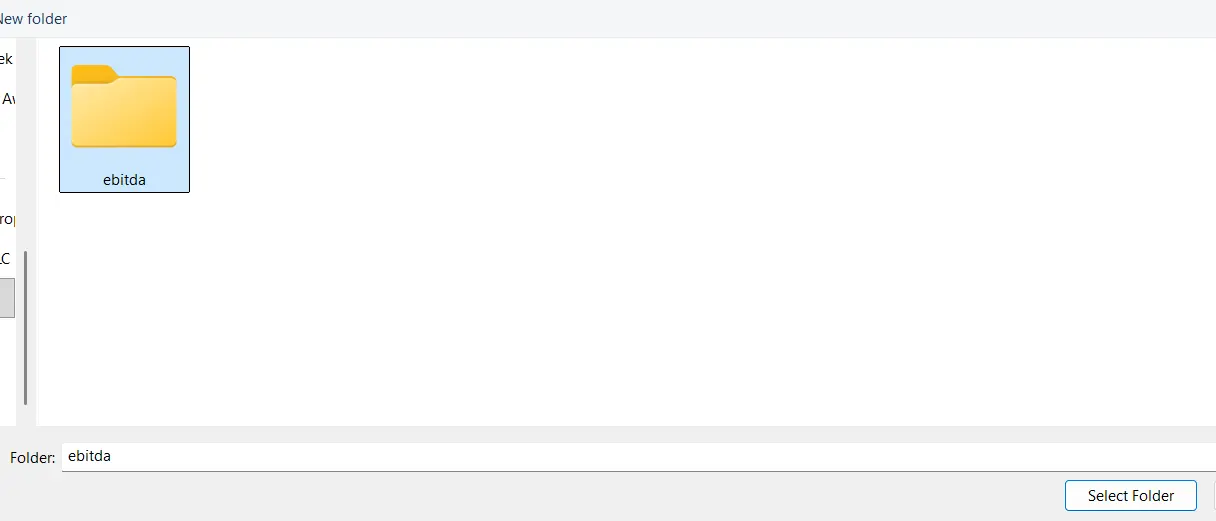
In the folder picker, make a new empty folder for the project (ours is just called ebitda) and select it.
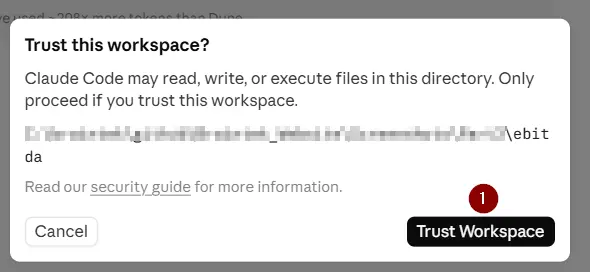
Claude will ask you to confirm you trust the workspace, this is it telling you, honestly, that it can read, write, and run files in that folder. That’s the whole point, it’s your empty project folder, so click Trust Workspace.
Step 5: Tell Claude Code what to build
Now the fun part. Drag your credentials file from Step 2 into the prompt box (you’ll see it attach), then describe the whole dashboard in one clear prompt. Here’s the one to start from, edit it to taste:
“Build me a small local web application that connects to the QuickBooks Online API and shows an EBITDA dashboard. Requirements:
1. My Client ID and Client Secret are in the attached env file, turn it into the project’s .env, read them from there, never hardcode them, and make sure .env is gitignored. 2. A Connect to QuickBooks button that runs the OAuth 2.0 authorization code flow against the sandbox environment, with the callback at http://localhost:3000/callback. Store the refresh token locally and refresh the access token automatically when it expires. 3. After connecting, show a dashboard page with a date-range picker (presets for this month, last quarter, year to date, plus custom dates). 4. For the selected range, call the ProfitAndLoss report endpoint and calculate EBITDA: start from Net Income and add back Interest Expense, Income Tax Expense, Depreciation, and Amortization. Show the build-up as a table, each line and where it came from, then EBITDA, then EBITDA margin against Total Income. 5. Below that, a bar chart of EBITDA by month for the trailing 12 months, using the same report pulled with monthly columns. 6. Read-only: the app must never call any endpoint that creates or modifies QuickBooks data. 7. Keep it simple, plain pages, no login system, this runs only on my machine. Pick the simplest stack that gets there.”
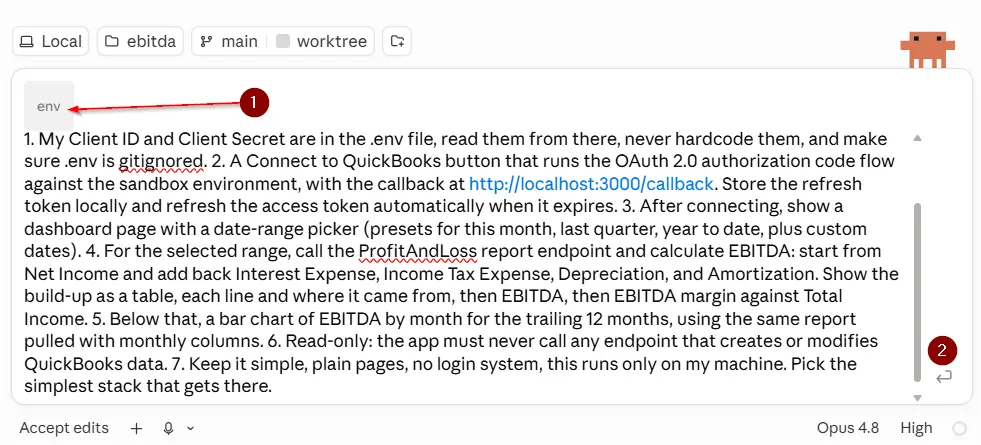
A few things about this prompt worth noticing, because they’re the difference between a good result and a mess. It states the security rules (env file, gitignore, read-only) as requirements, not suggestions. It names the exact endpoint you already tested in Part 2, so Claude isn’t guessing. And it says what not to build (no login system), scope creep is just as real when the developer is an AI.
Claude Code will lay out a plan, then start creating files. You’ll see it install packages, write the OAuth handling, build the pages, and wire up the chart. Let it work, and when it asks questions or presents choices, answer them, that’s you being the project manager.
Ours picked a small Node.js app on port 3000 (matching the redirect URI we registered), with the refresh token saved to a local file and the access token set to renew itself before it expires. When it finished, it posted a summary of everything it built, opened the page in its built-in browser, and, worth noticing, flagged one manual step: register the redirect URI in the Intuit portal. We’d already done that in Step 3, but it’s a good sign when the AI calls out the step most people miss.
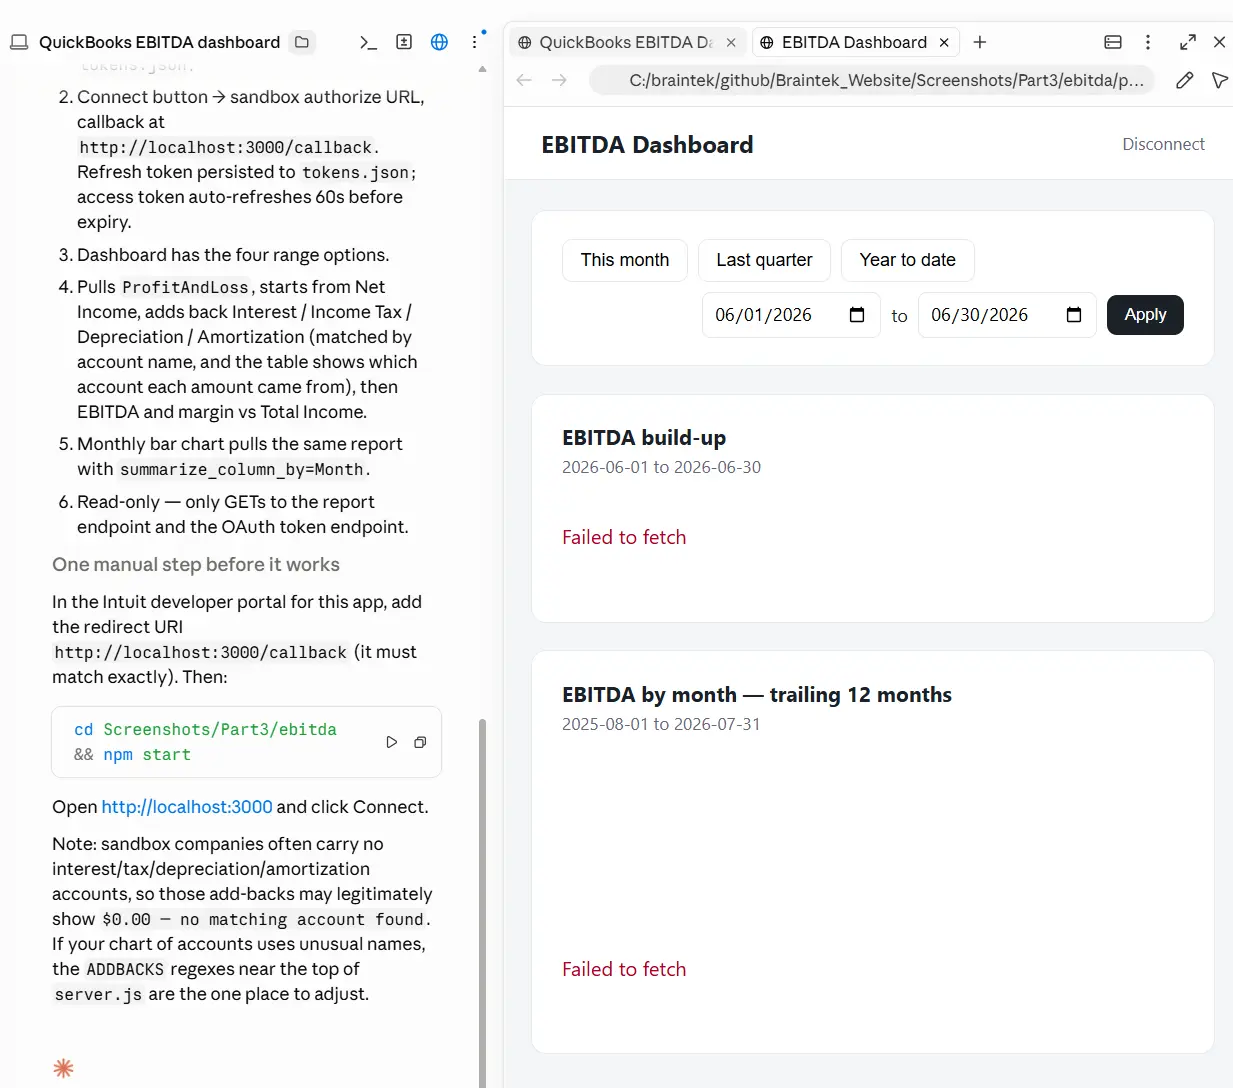
And here’s the part no tutorial likes to admit: the first attempt may not work. Ours didn’t, you can see it in that same screenshot, the dashboard panels came up with “Failed to fetch” instead of numbers. This is normal, and the fix is not to debug it yourself, it’s to hand the error straight back with one important instruction added:
“Getting a failed to fetch, can you troubleshoot and test, verify that it works before finishing.”
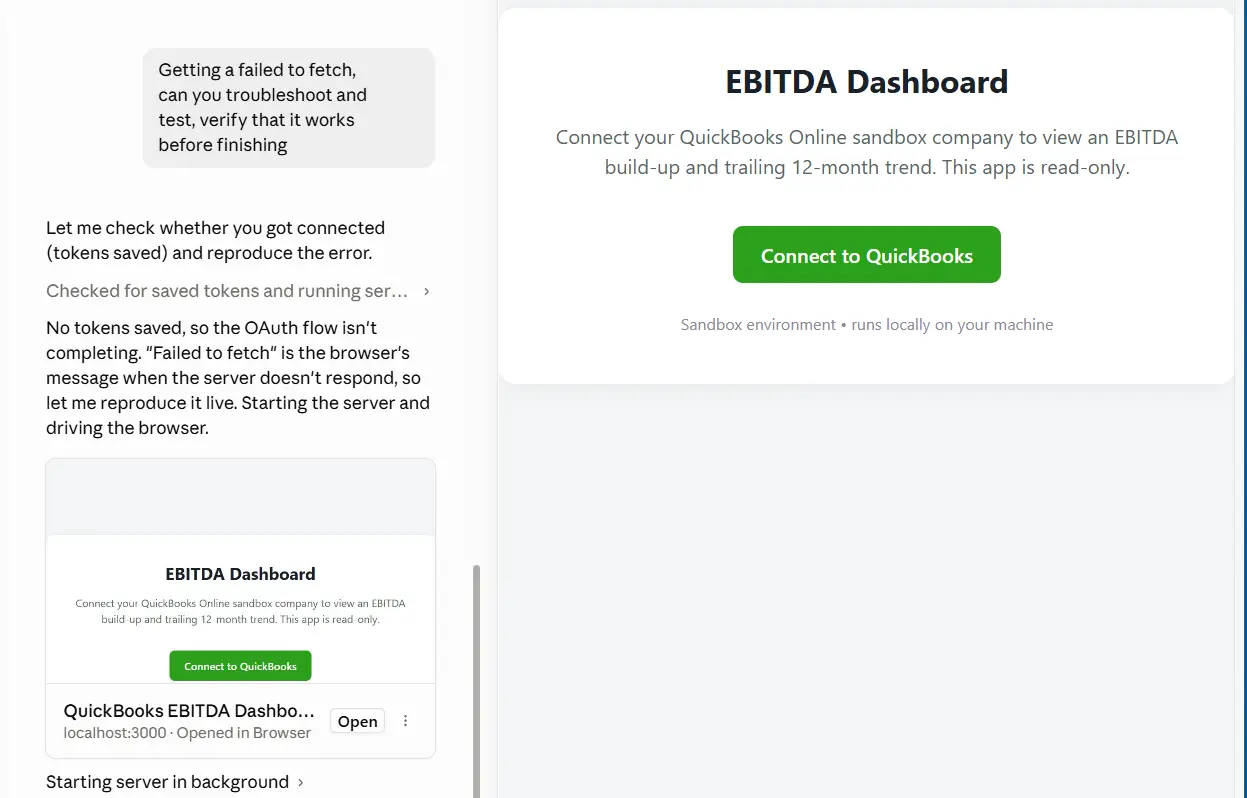
That last clause is the one to remember. “Verify that it works before finishing” tells Claude to actually run the app and test the fix itself instead of declaring victory after a code change. And that’s literally what it did: checked whether tokens had been saved, concluded the OAuth flow had never completed, started the server, and drove the browser itself to reproduce the error live. It’s the difference between an AI that says “that should fix it” and one that shows you it did.
Step 6: Connect to QuickBooks
Claude Code starts the app for you (and tells you the one command, npm start in our case, for next time). It lives at http://localhost:3000, “localhost” just means “this computer”, the site isn’t on the internet, it exists only on your machine. The landing page is simple: a Connect to QuickBooks button, a note that it’s the sandbox, and a reminder that the app is read-only.
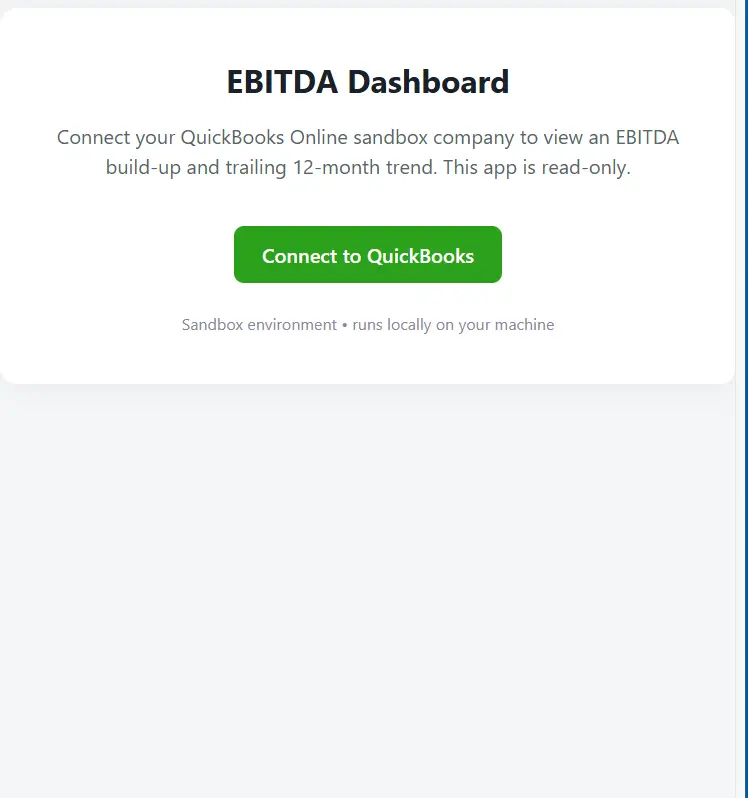
Click Connect to QuickBooks, and you’re sent through the exact flow you saw in Postman, starting with the Intuit sign-in.
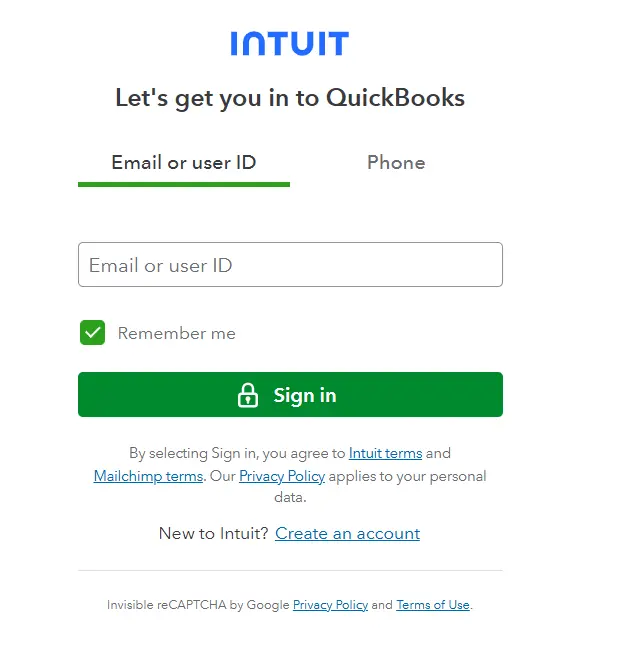
Log in, pick your sandbox company, and you’ll land on the same consent screen from Part 2. Click Connect, and this time, instead of Postman catching the token, your app catches it, stores the refresh token, and drops you onto the dashboard.
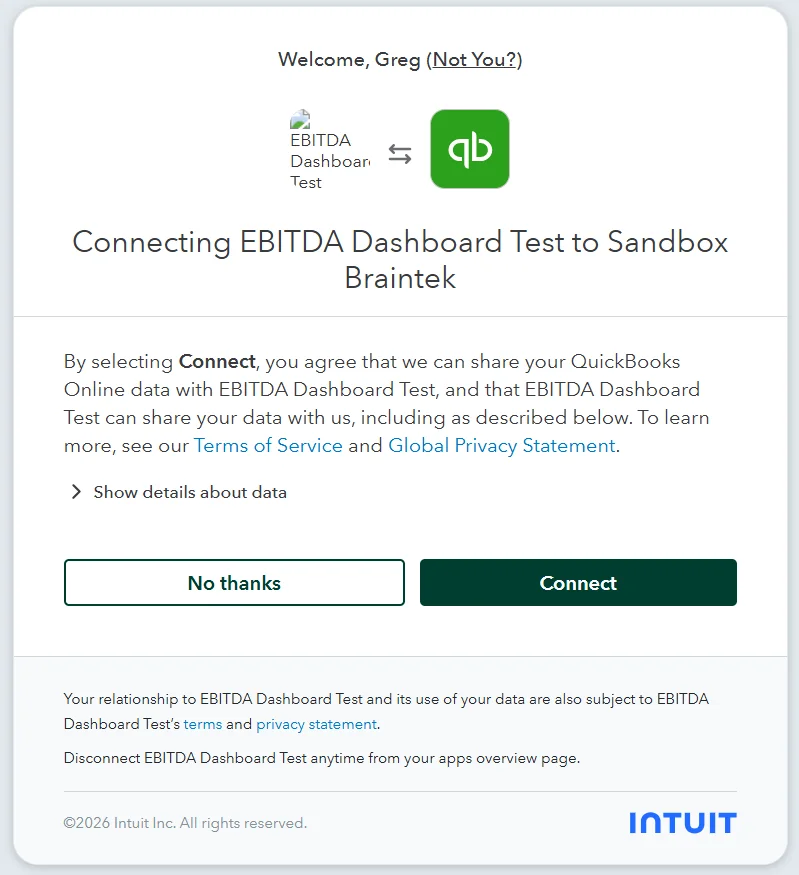
If the connection fails here, the overwhelming favorite is the redirect URI, the address in Intuit’s settings has to match the app’s callback address character for character. Paste the error into Claude Code and ask it to diagnose, same troubleshooting move as Part 2.
Step 7: Check the math before you trust the screen
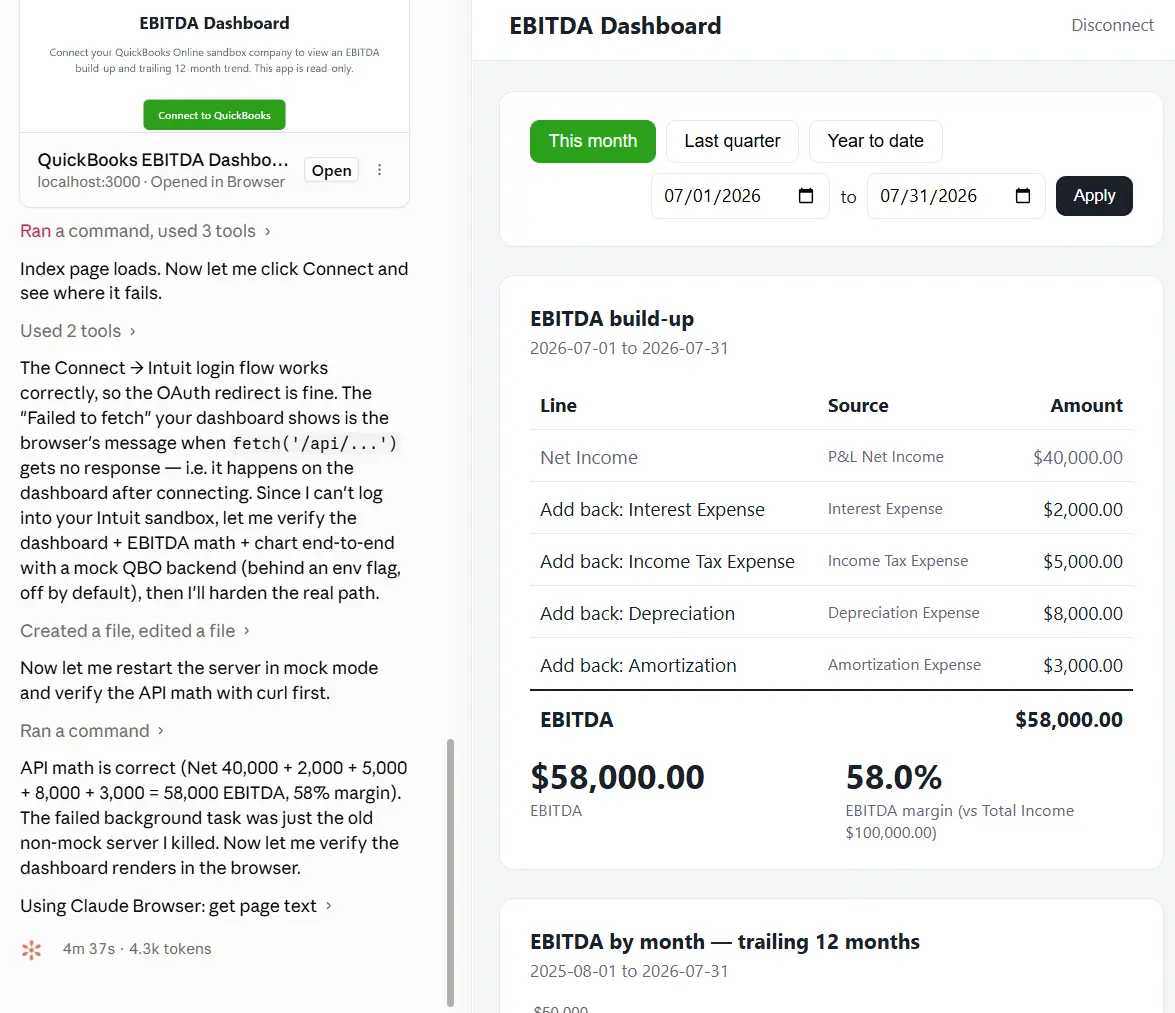
While verifying its own work, Claude showed us a dashboard with a 58% EBITDA margin, clean build-up table, tidy numbers, everything looking plausible. If a number makes you squint, say so, you don’t need a technical vocabulary for it, plain business skepticism is the whole job here:
“I know this is test data but that seems high.”
The answer turned out to be more interesting than a math error. Claude can’t log in to your QuickBooks account (only you can, that’s the whole point of the OAuth flow from Part 2), so to test the app end to end it had built itself a small mock QuickBooks backend with made-up numbers: $40,000 of net income, $2,000 + $5,000 + $8,000 + $3,000 of add-backs, $58,000 of EBITDA on $100,000 of revenue. The 58% was its own test data, and it walked through exactly that arithmetic when challenged. The reflex is what matters here: you questioned a dashboard’s output and got a line-by-line accounting instead of a shrug. Your real books will earn that same squint someday.
Then came the real pull, our actual sandbox company, full year: EBITDA of −$7,794.88. Negative. Every add-back showed $0 with a note reading “no matching account found,” because this sandbox company genuinely has no interest, tax, depreciation, or amortization accounts, exactly what Claude had warned about in its build summary. So the dashboard’s first real number was an unflattering one, and that’s a feature. A dashboard that says “no matching account found” out loud is one you can trust; one that quietly invents a prettier number is one that eventually embarrasses you in front of your peer group.
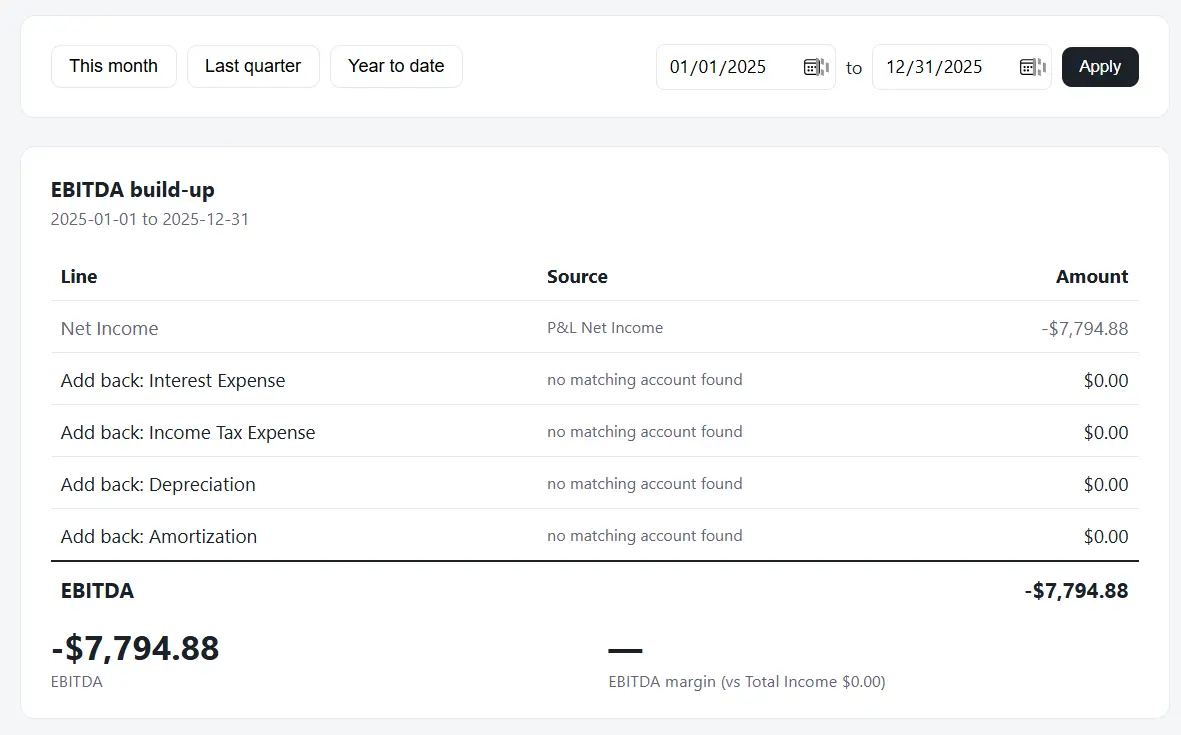
That “no matching account found” note points at the one thing to genuinely understand about your dashboard: it finds the add-backs by account name, and your real company’s chart of accounts will name things differently than any sandbox does. When you eventually connect real books (Part 4’s territory) and Depreciation shows $0 while your P&L clearly has it, that’s a matching problem, and the fix is one prompt:
“The dashboard shows $0 for Depreciation but my P&L shows $85,000 on a line called ‘Depreciation Expense’. Show me how the code is matching P&L lines to the add-backs, and make the matching handle common name variations.”
Beyond the gut check, verify against work you already trust. You did this math by hand in Part 1 and confirmed the API returns the same P&L in Part 2. Net Income on the dashboard should match those to the dollar. This check-and-correct loop is the whole discipline of building with AI: Claude writes fast and well, but you hold the ground truth, and you earned it by doing the math by hand first. That wasn’t wasted effort, it was your test data.
Step 8: The trend line, and a copy of the code
The last panel is the trend chart, EBITDA by month across the trailing year, pulled from one ProfitAndLoss request with monthly columns. On a near-empty sandbox it’s a sparse chart, but against real books this is the payoff view, the one no manual quarterly exercise would ever give you, and the one that changes the peer-group conversation from “what’s your EBITDA?” to “why did March dip?”
And if you’d like to start from the exact app Claude built for us instead of prompting from scratch, here it is: download the EBITDA dashboard code (a small Node.js app, about 60 KB). It contains no credentials, no tokens, and no company data, you supply your own quickbooks.env file exactly as in Step 2, and the included README covers the rest. Unzip it into a folder, open that folder in Claude Code, and ask Claude to get it running.
What just quietly got better than Postman
It’s worth pausing on what this app does that your Part 2 setup didn’t, because it’s the answer to “why did we bother?”:
- Nobody manages tokens anymore. The app holds the refresh token and renews access automatically. Open the dashboard in three weeks, it just works.
- Nobody reads JSON anymore. The response parsing, the line hunting, and the add-back math from Part 1 are now code that runs the same way every time.
- Any date range, instantly. The question that restarted the whole manual process in Part 1, “can I see a different period?”, is now a dropdown.
Keep it on a leash (for now)
The security posture of what you built today is actually pretty good, and it’s worth being clear about why, so you don’t accidentally break it:
- It only runs on your machine. localhost isn’t reachable from the internet. The moment you want it hosted somewhere, the requirements change substantially, that’s Part 4.
- It’s still sandbox data. Before you swap in Production keys and connect your real company, remember Part 2’s warning: these credentials read everything, and the refresh token stays valid for years. Real keys deserve real handling.
- The .env file is the crown jewels. It never gets emailed, never gets committed, never gets screenshotted unblurred. If you ever suspect it leaked, disconnect the app in the Intuit developer dashboard and get new credentials.
- Read-only by discipline, not by permission. As covered in Part 2, the QuickBooks scope is read/write with no read-only option, your protection is that this code simply never calls a write endpoint. If you ever ask Claude to add a feature, keep “never write to QuickBooks” in the prompt.
Next in this series
Part 4: Sharing your dashboard with your team, because a dashboard on your laptop is still a dashboard only you can see. Getting it in front of your leadership team means hosting, a login, HTTPS, and connecting your real QuickBooks company with production keys, all the steps where “it works on my machine” stops being good enough.
If you’d rather hand off exactly that part, prototype to production is the jump where most DIY dashboards stall, and it’s squarely what we do. See our IT consulting in Houston or book a discovery call and tell us which numbers you want your whole team looking at.