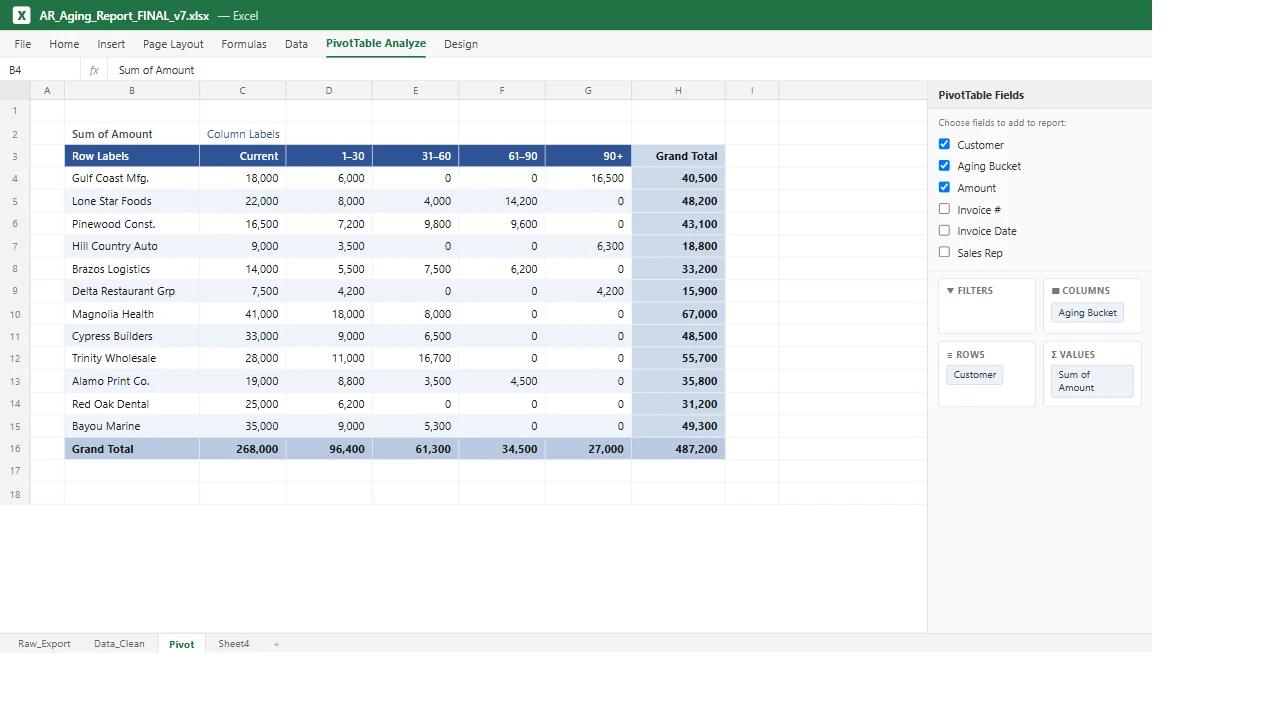
Walk into most finance and operations teams and you’ll find the same quiet ritual. Someone logs into the ERP, or QuickBooks, or the line of business system. They run an export. They paste it into Excel. Then they spend the next few hours, every week and sometimes every day, cleaning, sorting, and rebuilding the same pivot tables and charts they built last week, so that leadership can finally see a number.
It feels like work because it is work. But almost none of it is the work you’re actually paying for.
The hidden tax on your best people
Say a controller spends six hours a week pulling data and rebuilding a cash flow view, an aging report, and a sales summary by hand. That adds up to roughly $15,000 to $20,000 a year in salaried time spent on data plumbing. Copying, formatting, reconciling. None of it is analysis, judgment, or the work you actually hired them to do.
And that’s only the labor line. The bigger cost sits underneath it:
- Latency. By the time the report reaches your desk, the numbers are three to five days old. You’re steering by last week’s dashboard.
- Errors. Every manual copy and hand built formula is a place for a mistake to creep in, and the person checking the report is the same person who built it.
- Key person risk. The report lives in one spreadsheet, on one laptop, in one person’s head. When they’re out, the reporting is out with them.
Why it persists
Here’s the part that surprises most executives: the data already exists, cleanly, inside the systems you already own. The ERP knows your margins. QuickBooks knows your cash position. The CRM knows your pipeline.
The gap was never the data. The gap was the connection between where the data lives and where you need to see it. For years, the only bridge available was a person with an export button and a spreadsheet. Excel became the duct tape holding your reporting together.
What changed
Two things, recently and at the same time.
First, modern business systems now expose APIs, which are secure, official doorways that let other software read their data on your behalf. We can connect to the ERP or QuickBooks and pull exactly what you need, automatically, on a schedule, with no one touching an export button. (If you want the plain-English version, start with What Is an API? and How AI and APIs Work Together.)
Second, AI now handles the part that used to require a person. The “massaging.” Categorizing transactions, reconciling mismatches, summarizing the variance, even writing the plain-English narrative that explains why this month looks different from last. The judgment step that justified keeping a human in the loop is increasingly something software does well.
Put those together and the weekly ritual disappears. The data flows on its own, the AI shapes it, and the result is a live dashboard.
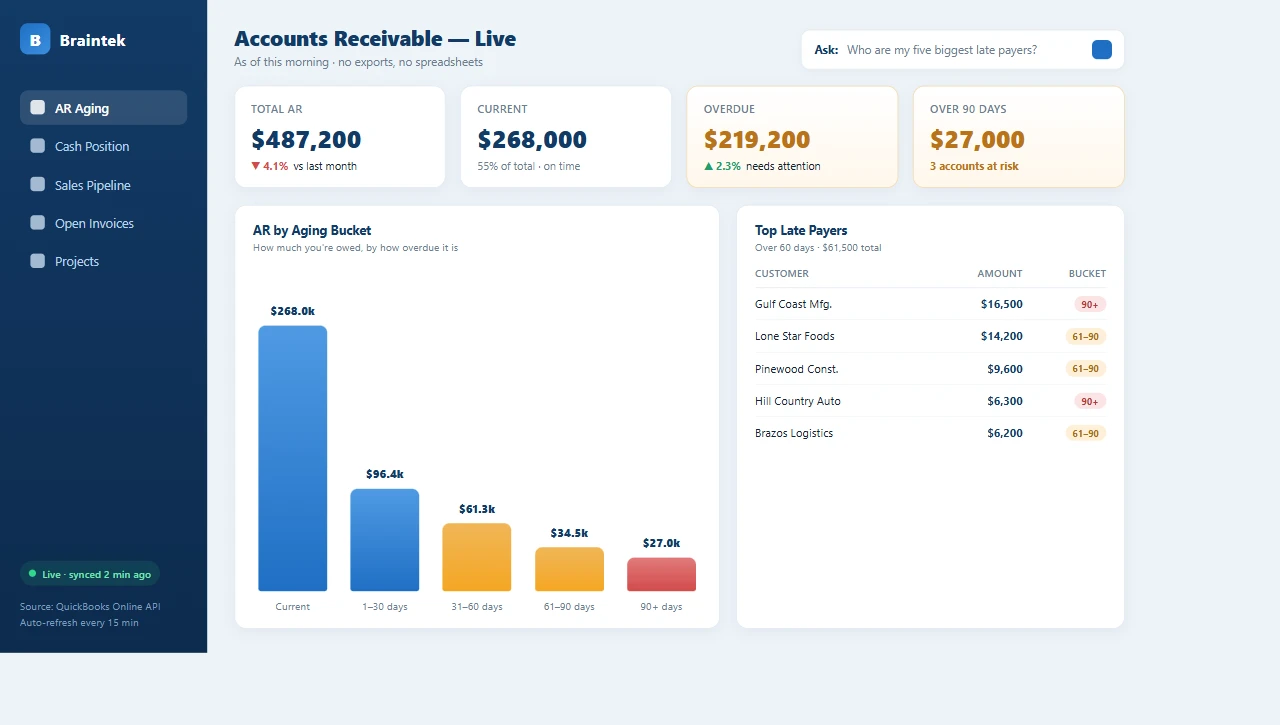
What it looks like instead
Imagine opening one screen and seeing your cash position, your aging report, and your top line numbers, all current as of this morning rather than last Tuesday. No deck to wait for. No analyst pulling a late night before the board meeting. The numbers maintain themselves, and your team goes back to interpreting them instead of assembling them.
That’s the shift: from people building reports to people reading them. The report you used to rebuild by hand becomes a screen you just open. (For the full walkthrough of how this comes together, see From Database to Dashboard with AI.)
This is an outcome, not a piece of software
You don’t buy this off a shelf, and you don’t rip out the systems you already run. We build it on top of what you have, connecting to your specific ERP, your QuickBooks, your CRM, and we shape the dashboard around the decisions you actually make.
The smartest place to start is small and high value. Pick the one report your team rebuilds most often, usually cash position or the aging report, and let us automate that single view first. It’s a contained, fast win you can see in weeks rather than a year long integration project. Once it’s running and your team trusts it, we expand from there.
If someone on your team is exporting to Excel and rebuilding the same report by hand, there’s a faster, more accurate, always current way to get the same answer. This is squarely the kind of work we do as part of our IT consulting. Book a discovery call and tell us which report you wish built itself.